Excel Training: Pivot Table
The pivot table allows to summarize the data of a database so as to obtain the desired "crossings" of data.
The following example will help you better understand the interest of using a pivot table and will allow you to start seeing the potential of this powerful Excel feature.
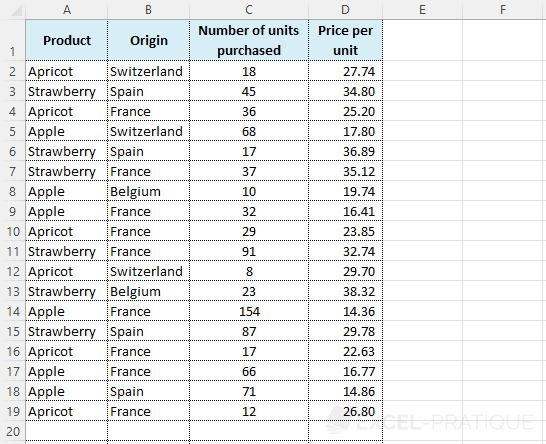
The small database of this example is as follows: lesson-11.xlsx
Inserting a pivot table
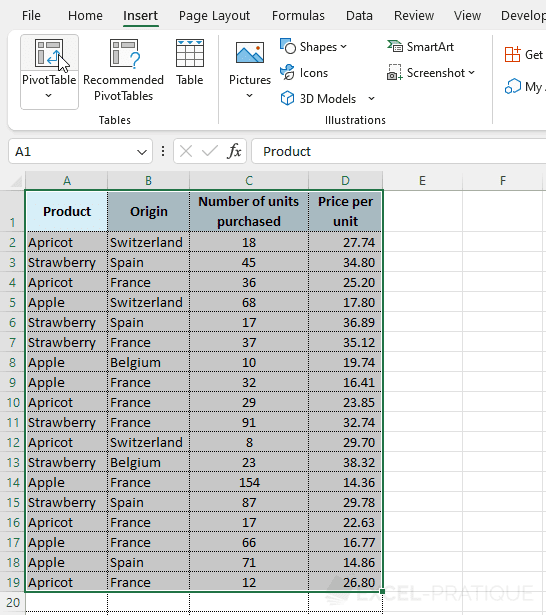
To add a pivot table, select the database (with headers) and click on "PivotTable" from the "Insert" tab:
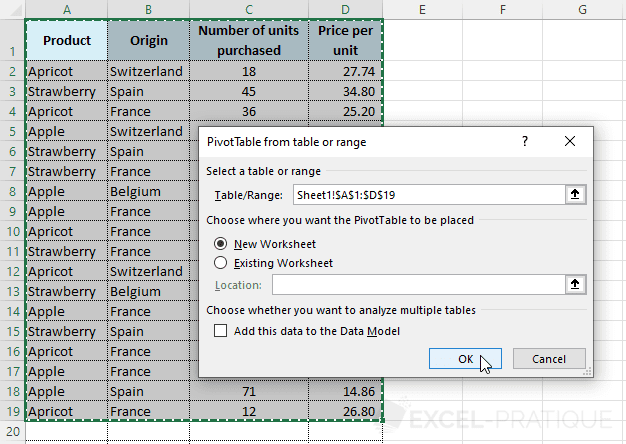
To insert the pivot table into a new sheet of the workbook, leave the default values and validate:
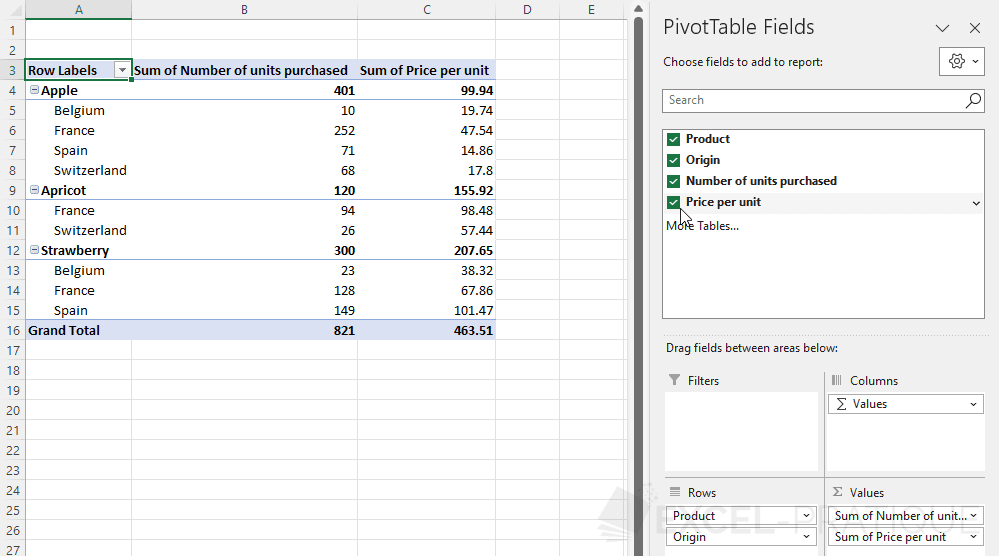
An empty pivot table is then created:
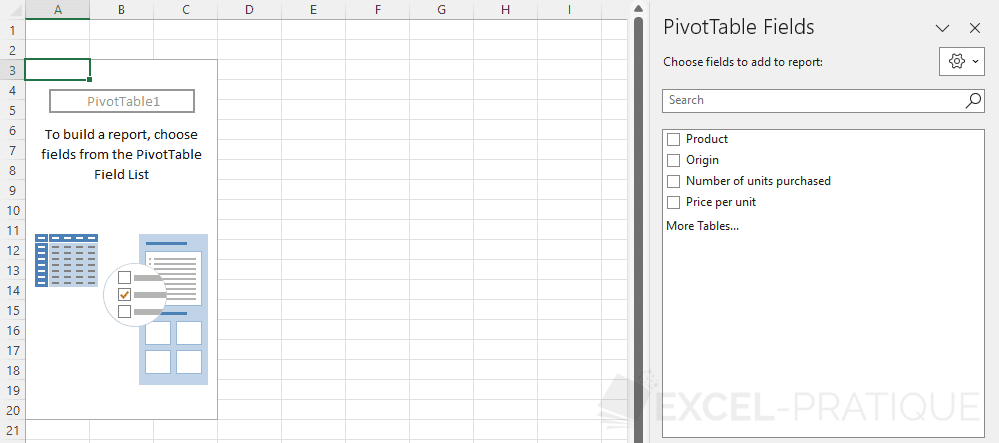
Then check the fields to be integrated into the pivot table (in this case, all fields):
Modifying a pivot table
The pivot table generated by Excel is not necessarily the one expected, so you can modify it as necessary.
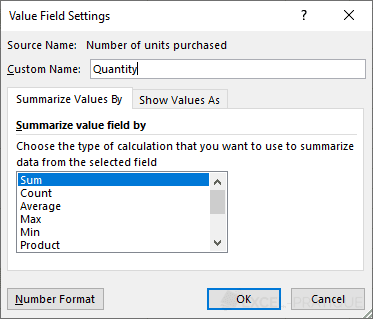
Let's start by renaming the field "Sum of Number of units purchased" by clicking on "Value Field Settings" of the same field:

Rename it to "Quantity":
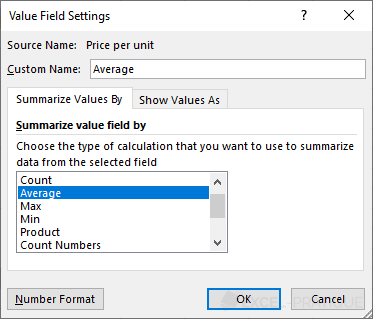
Then modify the parameters of the field "Sum of Price per unit", select the calculation type "Average" to display the average price, rename this field to "Average" and modify the "Number Format" to display the average in accounting format:
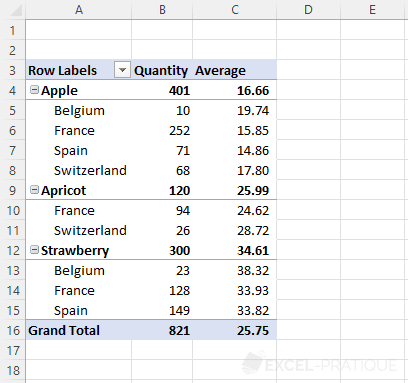
The 2 fields of this pivot table have been modified:
Changing the order
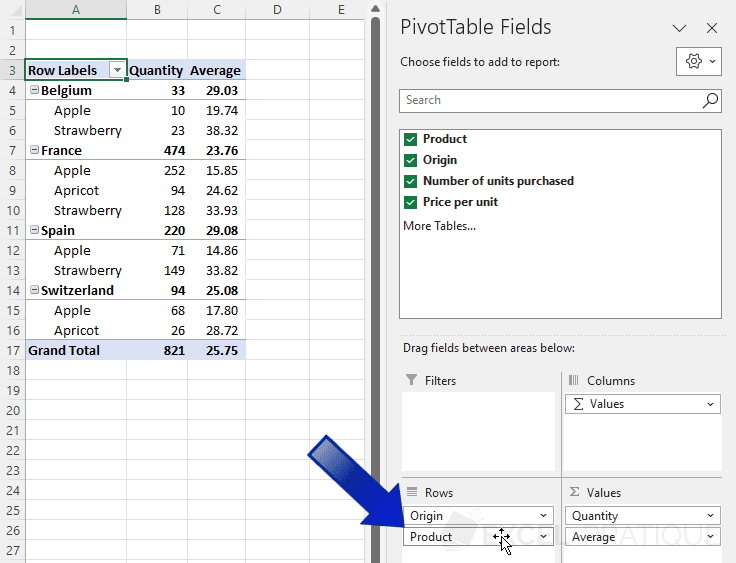
Currently, this pivot table displays the products and then their origin:
To reverse this order and display the different countries of origin and then the products, modify the order of the rows:
Adding a filter
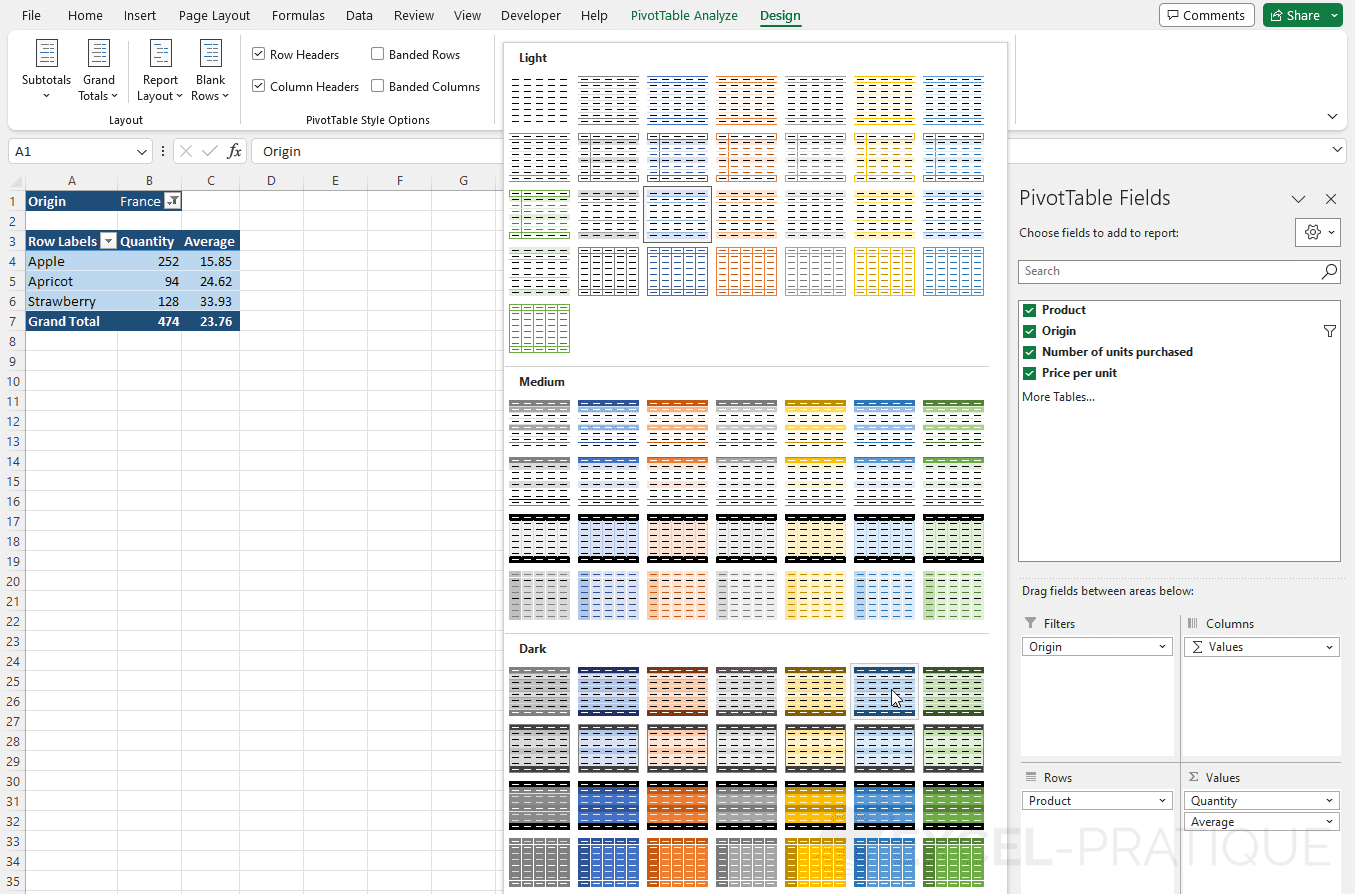
To display data only based on one or more countries, move the "Origin" field to "Filters" to add a filter that allows you to choose the countries to consider:

Applying a style
Finally, you can customize the style of the pivot table from the "Design" tab:
Conclusion
The Excel course ends here, hoping that it will help you in mastering this spreadsheet software.
If you enjoyed this course, you have the option to download the PDF of the entire course. This is an optional paid option that helps support the site and the development of new content.
To further enhance your Excel skills, you can explore examples of using key functions in Excel Functions.
If you want to learn how to create macros, a VBA course that starts from scratch is also available.