Excel Training: Charts
Insert a chart
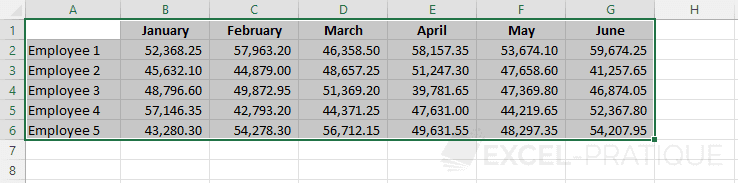
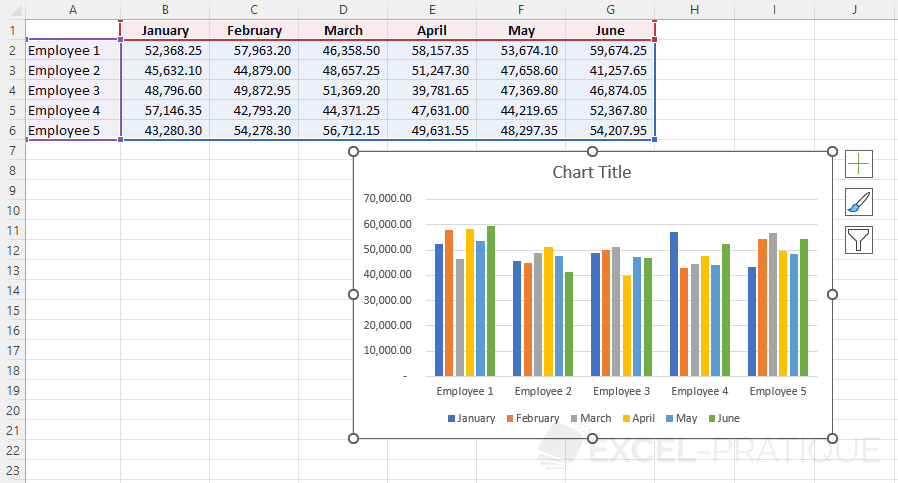
To insert a chart from the following table (lesson-7.xlsx), start by selecting the entire table containing the data:
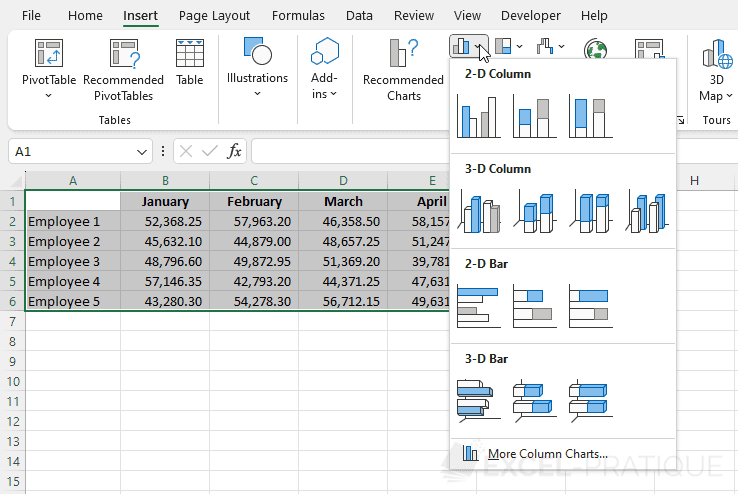
From the "Insert" tab, you can then choose the desired chart template:
If you're unsure of the desired template type, click on "Recommended Charts" to display suggestions and previews of different chart templates that may suit the selected data:
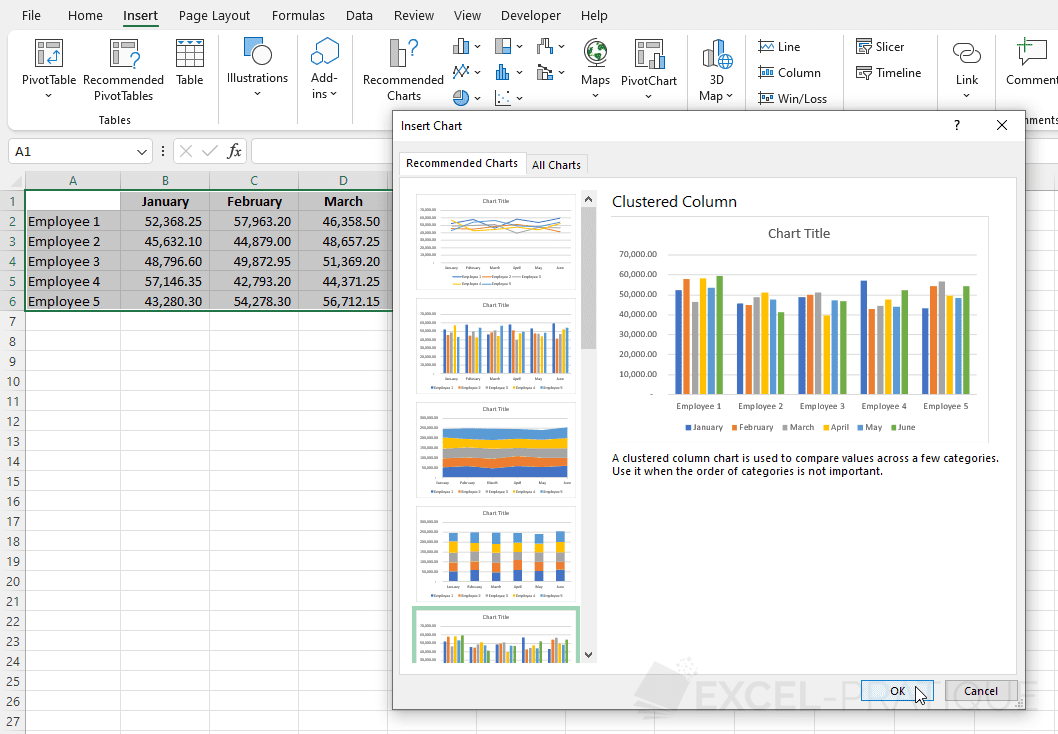
And validate your choice:
Customize the chart
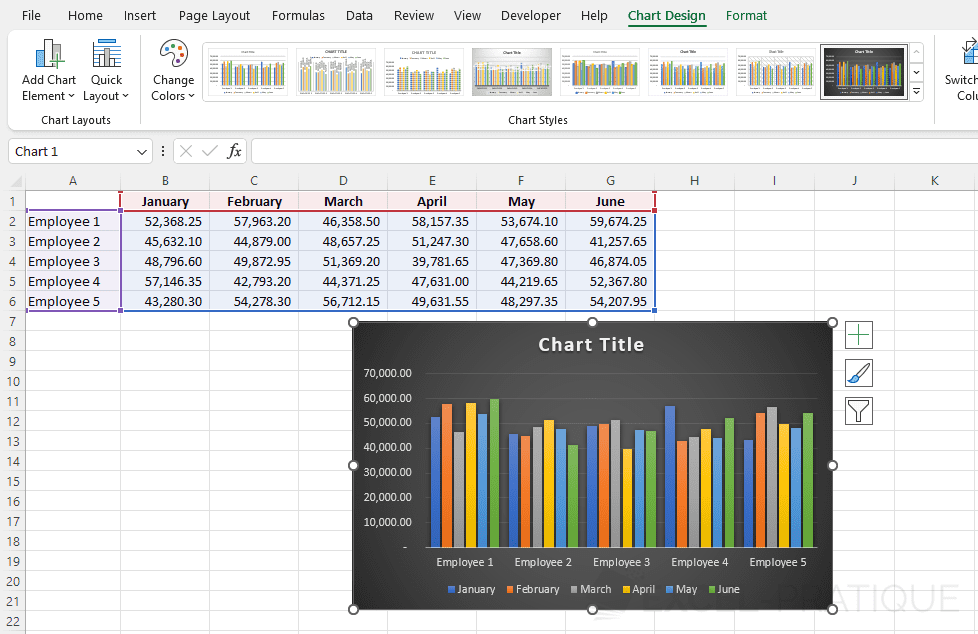
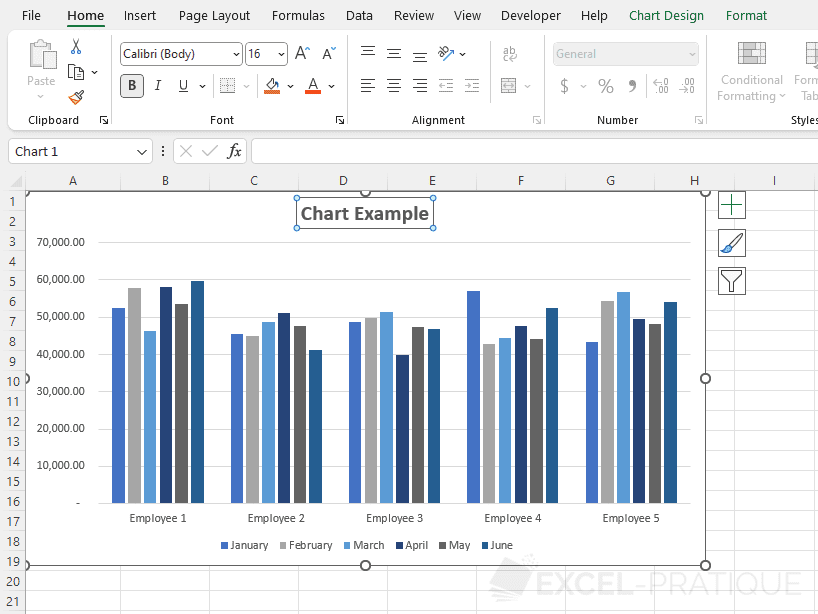
You can change the chart style if necessary from the "Chart Design" tab (after selecting the chart):
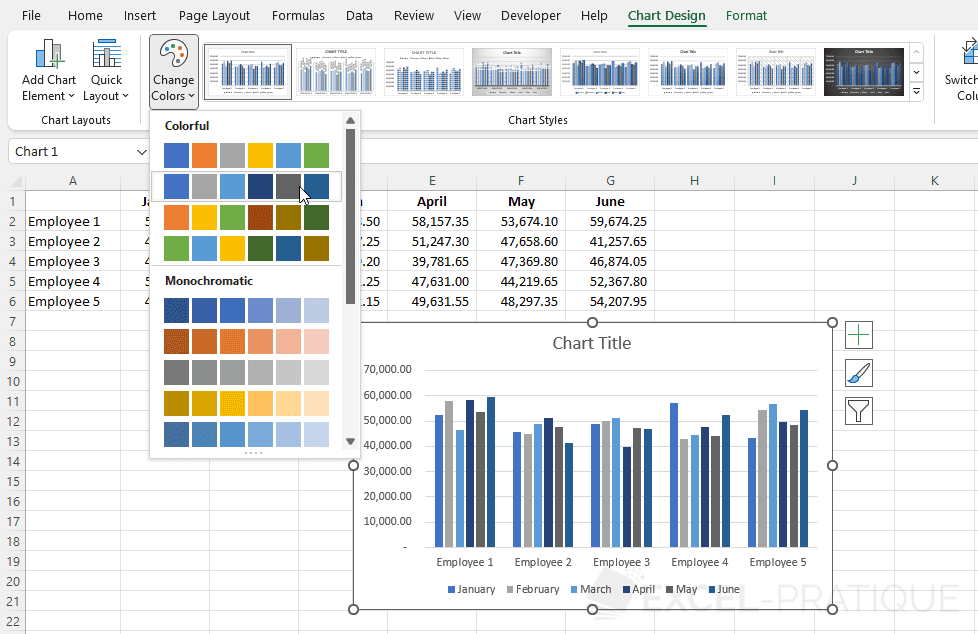
From this same tab, you can also change the chart's color palette:
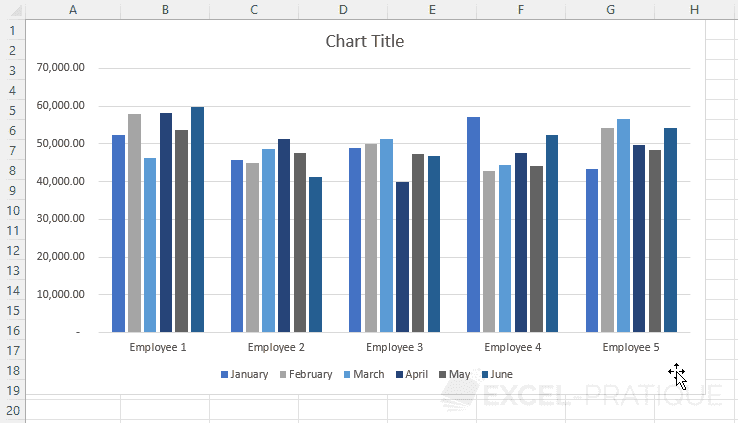
You can also move and resize the chart as if it were a simple shape:
Customize chart elements
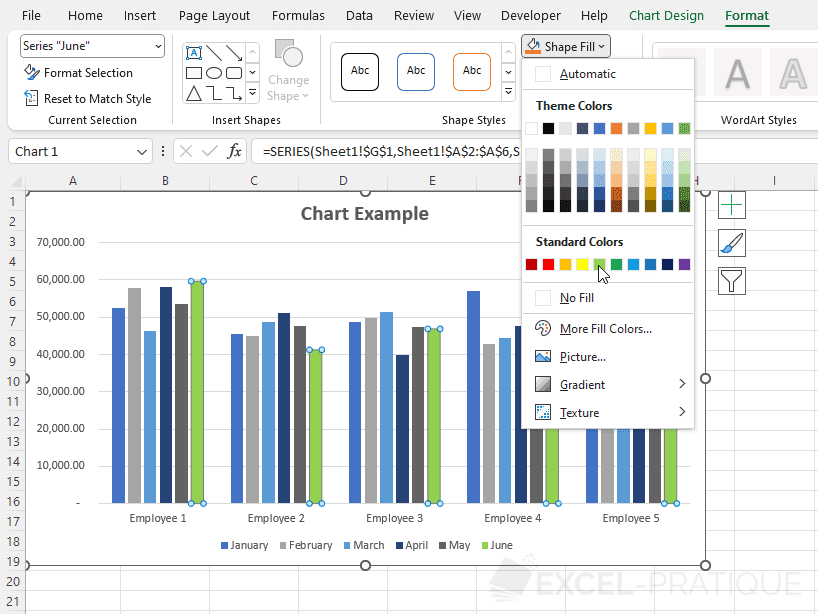
You can customize each element of the chart by selecting it and modifying it as if it were a shape or text box.
For example, the title:
Another example, the column of the last series:
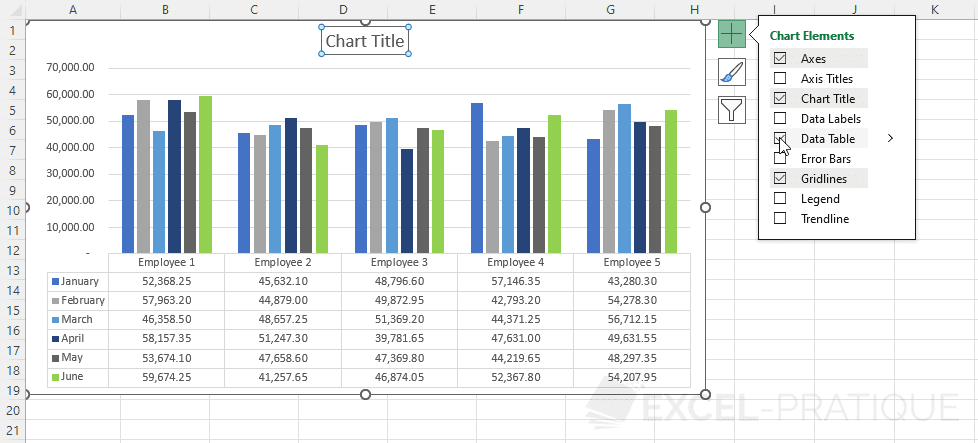
Add elements to the chart
You can add or remove certain elements from the chart by clicking on the + to the right of the chart: