Excel Training: SmartArt Charts
The SmartArt chart allows you to quickly create a visual representation of data.
It can be used for example to create an organization chart, a pyramid, a cycle, a process, lists, etc.
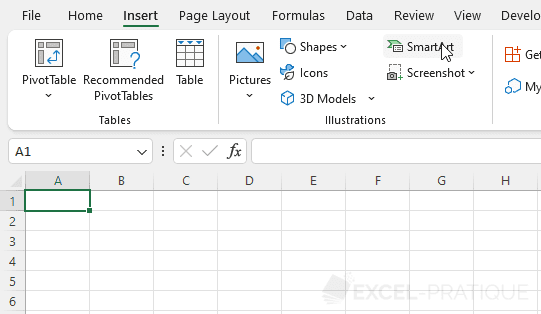
To insert a SmartArt chart, click on "SmartArt" from the "Insert" tab:
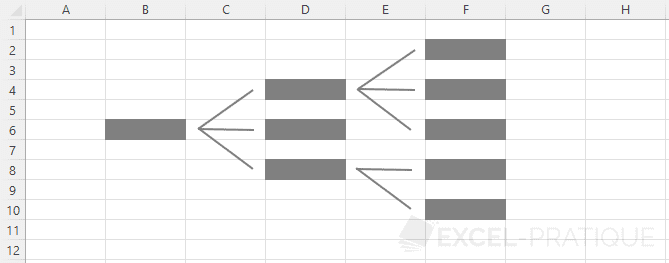
In this example, we will create a horizontal organization chart, so choose the following model:

The goal here will be to create an organization chart in the form of a SmartArt chart respecting the following structure:
Start by selecting the shape in the center and delete it by pressing the Delete key:
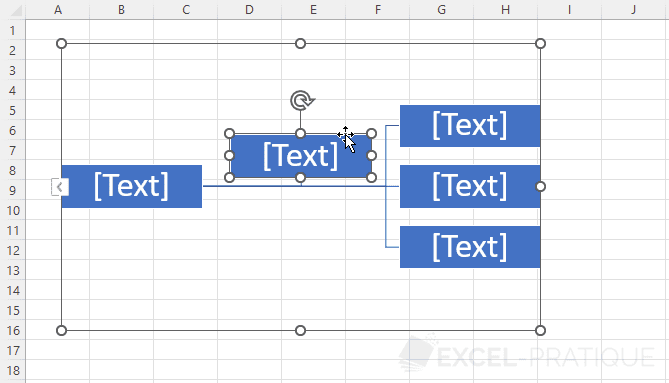
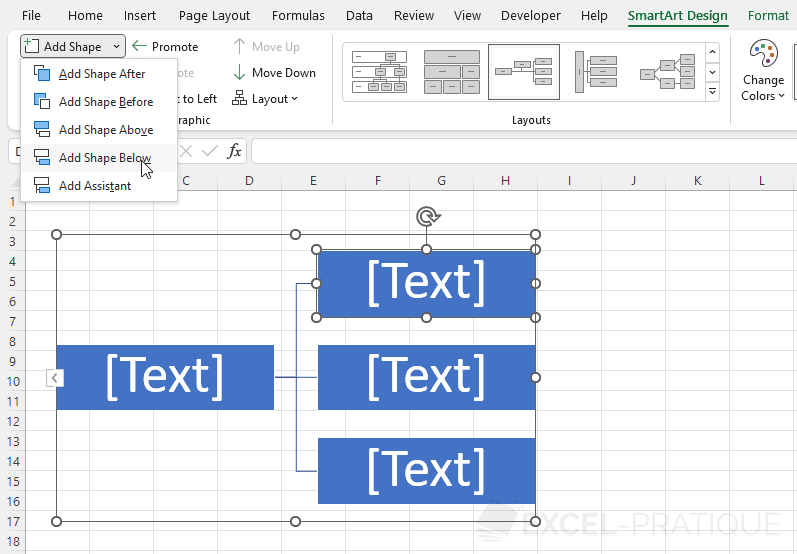
Now select the shape at the top right of the chart and click on "Add Shape Below" from the "SmartArt Design" tab:
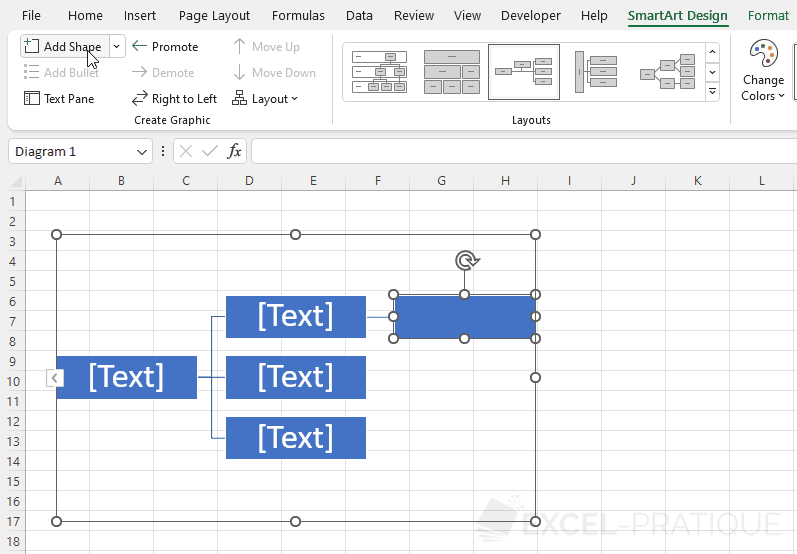
Then click 2 times on "Add Shape" to add 2 additional shapes:
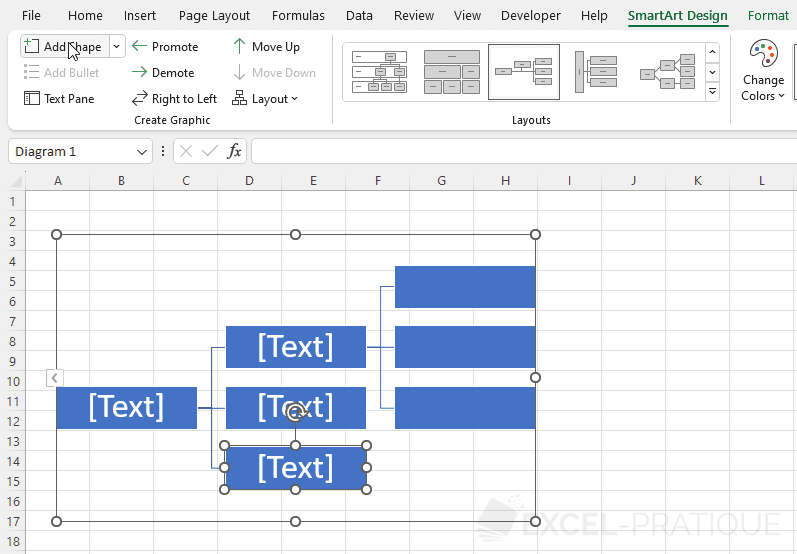
To add the last 2 shapes, select the one at the bottom of the chart and add 2 shapes:
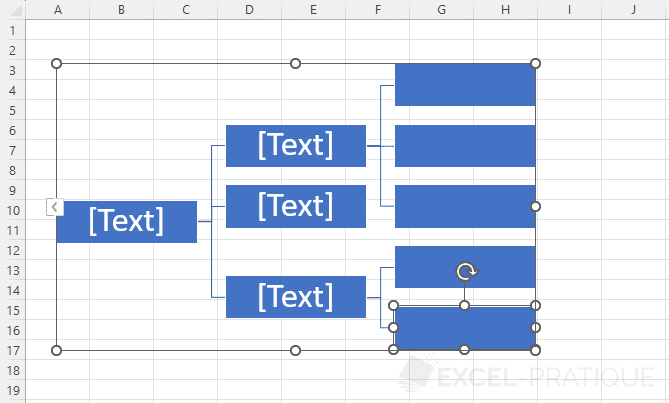
To get:
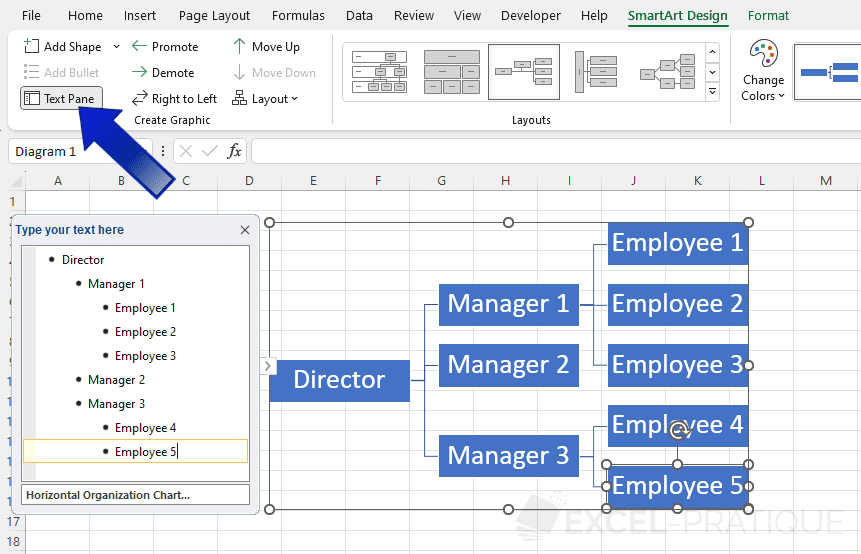
Modify the text
You can modify the text of each shape individually or more simply from the "Text Pane":
Modify the layout
If you need to modify the type of SmartArt chart, you can choose another layout from the "SmartArt Design" tab (after selecting the chart):

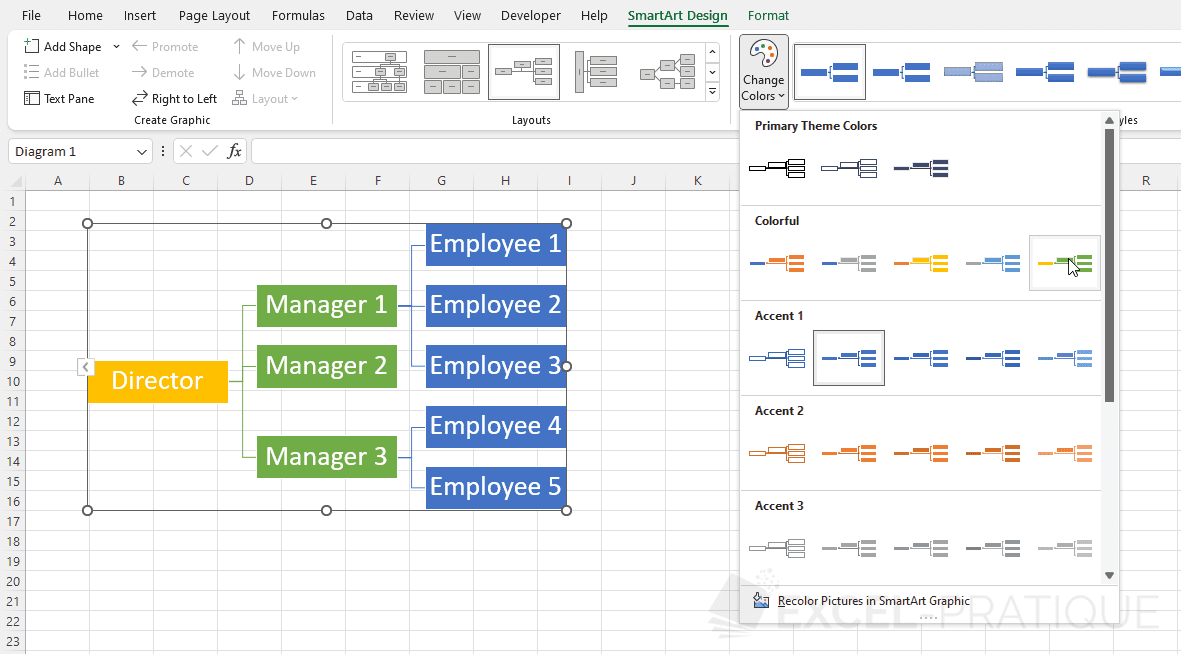
Modify colors and style
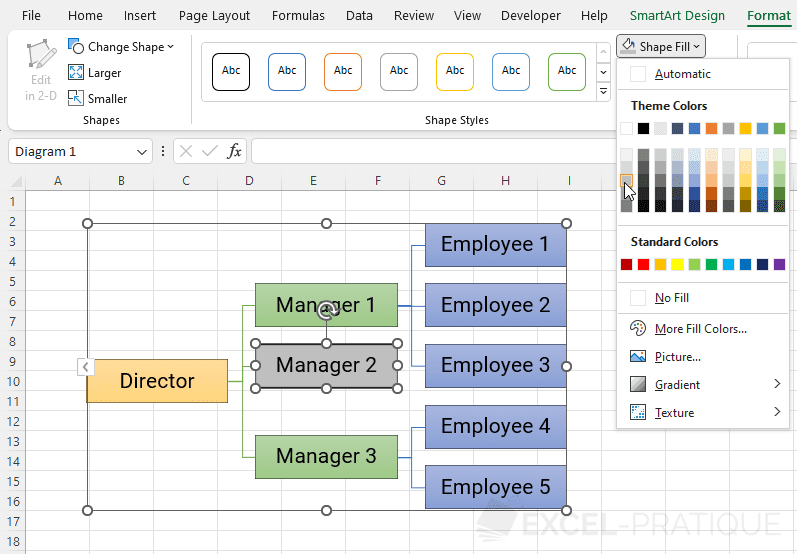
From this same tab, you can modify the colors of the chart:
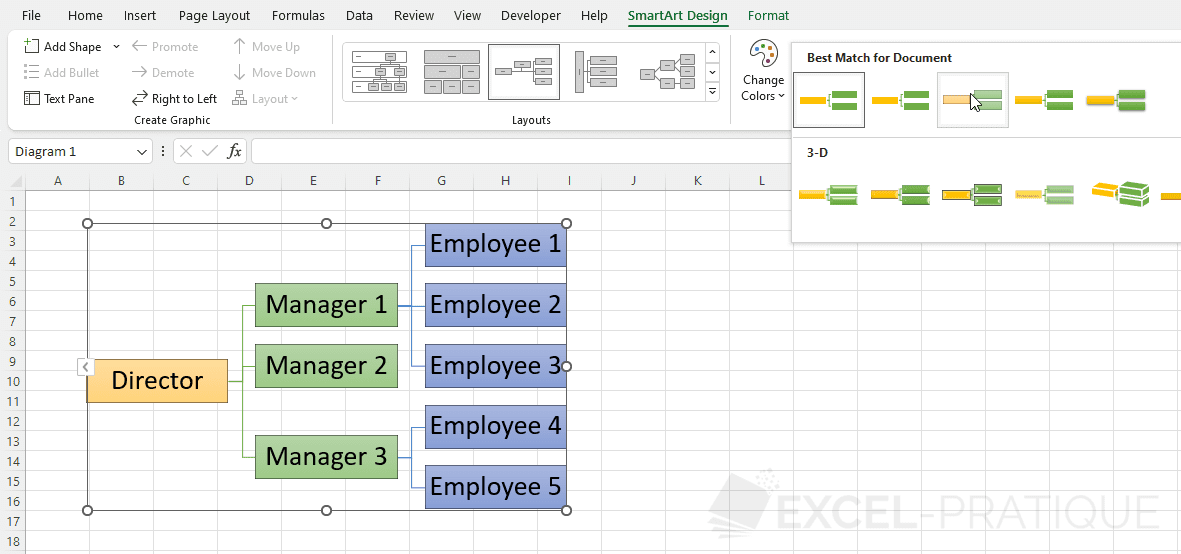
As well as its style:
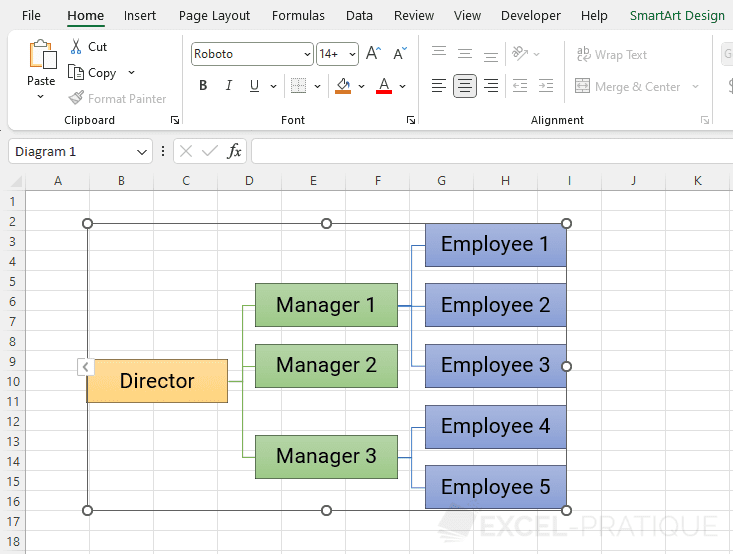
Modify the formatting of the text
From the "Home" tab, you can modify the formatting of the text of the SmartArt chart:
Modify a shape
By selecting one or several shapes (using the Ctrl key), you can customize the selected shapes from the "Format" tab as we saw earlier: