Excel Course: Inserting Graphs
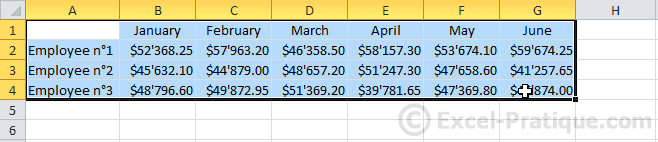
We will be using the following table throughout this lesson.
Source file: lesson7.xlsx
![select table data excel inserting graphs](https://www.excel-pratique.com/view/en/course/img/excel_inserting_graphs/select_table_data.png)
Select the table and choose a graph in the "Insert" tab.
![choose graph excel inserting graphs](https://www.excel-pratique.com/view/en/course/img/excel_inserting_graphs/choose_graph.png)
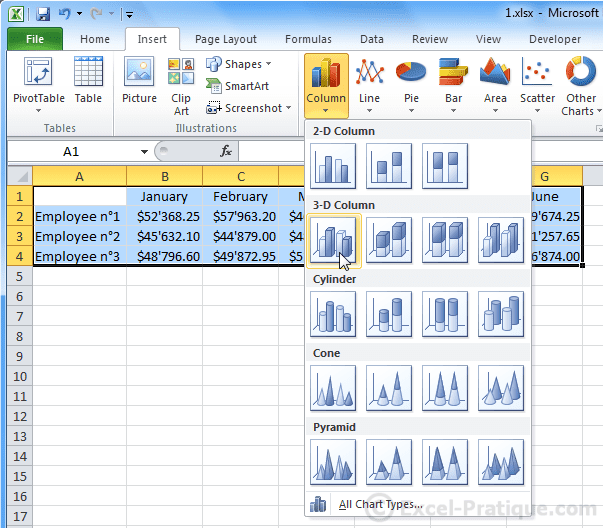
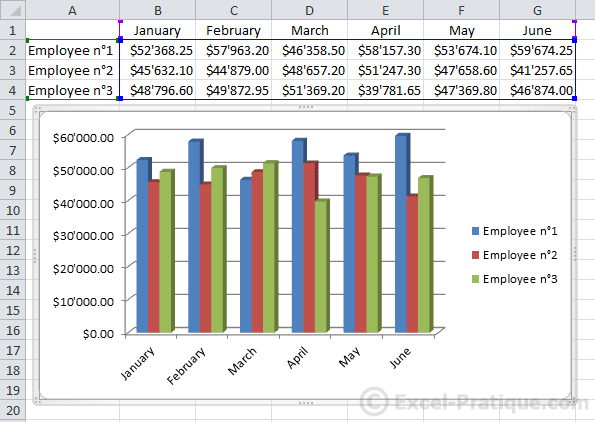
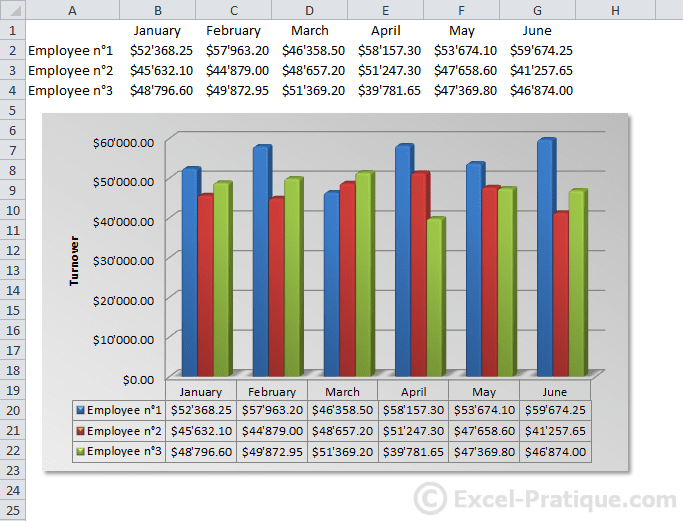
The graph will be inserted onto the sheet.
![insert graph excel inserting graphs](https://www.excel-pratique.com/view/en/course/img/excel_inserting_graphs/insert_graph.png)
Whenever the graph is selected, additional tabs will be displayed.
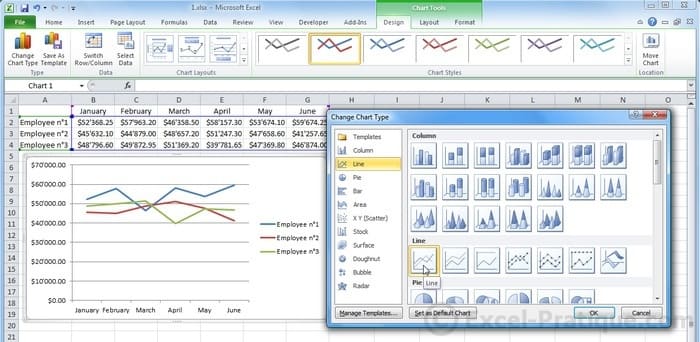
To change the type of graph (if needed), click on "Change Chart Type".
![edit graph type excel inserting graphs](https://www.excel-pratique.com/view/en/course/img/excel_inserting_graphs/edit_graph_type.png)
And choose a new type.
![line graph excel inserting graphs](https://www.excel-pratique.com/view/en/course/img/excel_inserting_graphs/line_graph.jpg)
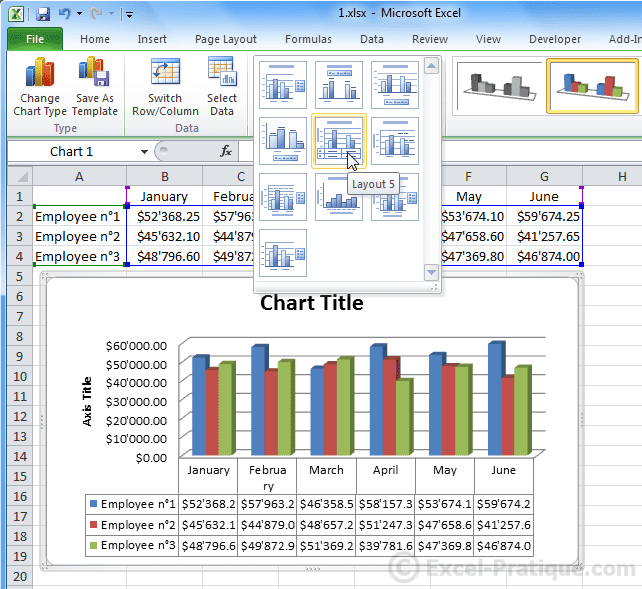
You can choose one of the predefined layouts.
![choose layout excel inserting graphs](https://www.excel-pratique.com/view/en/course/img/excel_inserting_graphs/choose_layout.png)
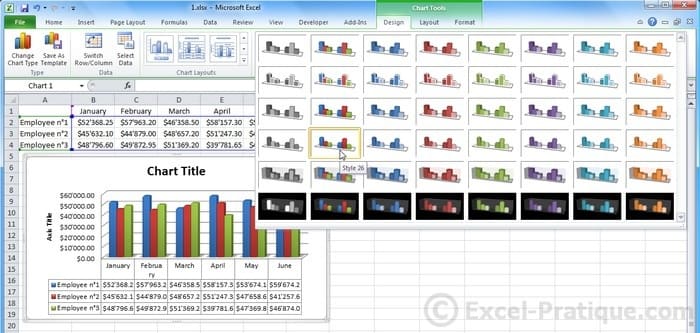
Or one of the predefined styles.
![graph styles excel inserting graphs](https://www.excel-pratique.com/view/en/course/img/excel_inserting_graphs/graph_styles.jpg)
From the "Layout" tab, you can add/remove/customize the following elements: titles, legends, labels, data tables, axis, gridlines, border, etc.
![graph title excel inserting graphs](https://www.excel-pratique.com/view/en/course/img/excel_inserting_graphs/graph_title.jpg)
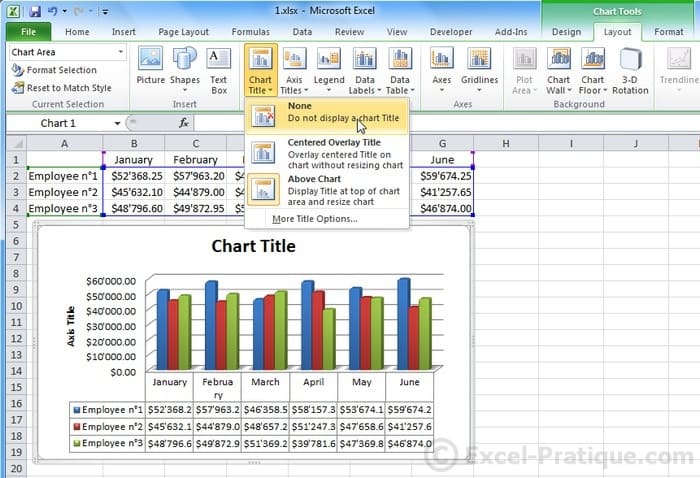
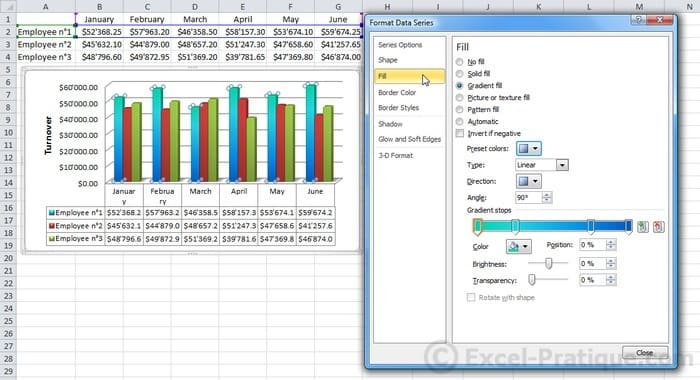
You can also customize these elements separately (by selecting them on the graph).
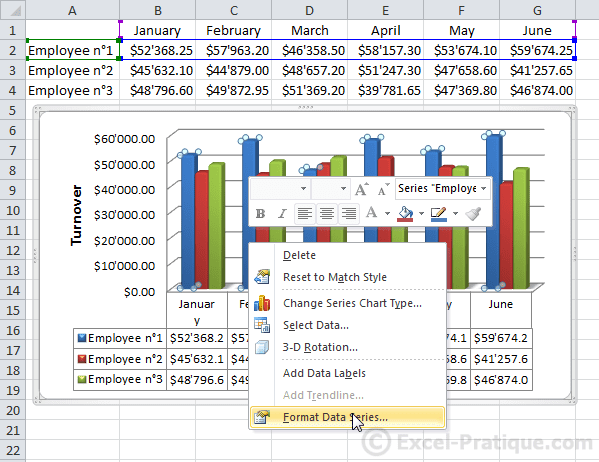
![select element excel inserting graphs](https://www.excel-pratique.com/view/en/course/img/excel_inserting_graphs/select_element.png)
For example:
![format element excel inserting graphs](https://www.excel-pratique.com/view/en/course/img/excel_inserting_graphs/format_element.jpg)
The "Format" tab for graphs is very similar to the "Format" tab that we have already discussed.
![format graph ground excel inserting graphs](https://www.excel-pratique.com/view/en/course/img/excel_inserting_graphs/format_graph_ground.jpg)
![example excel inserting graphs](https://www.excel-pratique.com/view/en/course/img/excel_inserting_graphs/example.png)
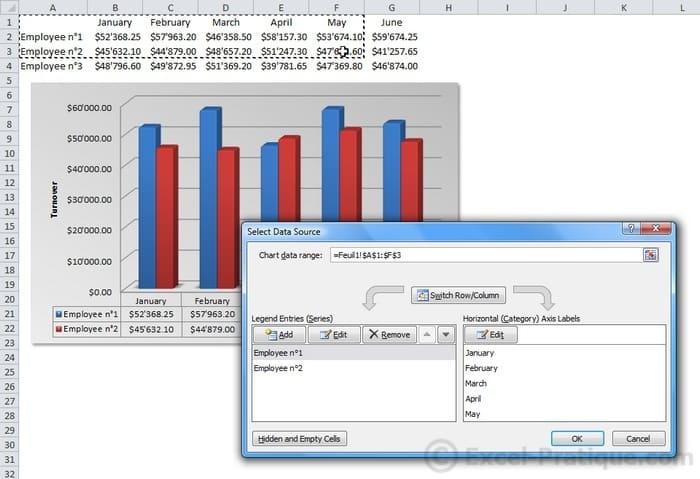
Changing a Graph's Data Source
To change the data range used to draw the graph, click on "Select Data Source...".
![select data source excel inserting graphs](https://www.excel-pratique.com/view/en/course/img/excel_inserting_graphs/select_data_source.png)
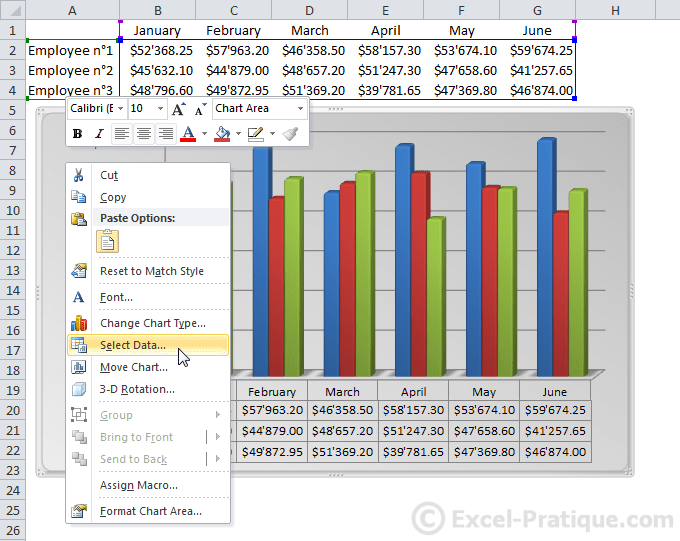
Then simply edit the range (by selecting it on the sheet).
![display excel inserting graphs](https://www.excel-pratique.com/view/en/course/img/excel_inserting_graphs/display.jpg)