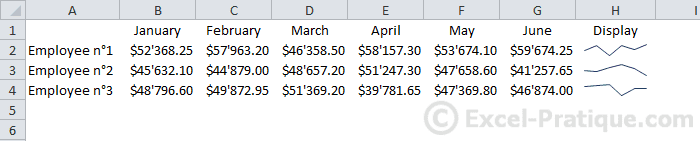
Excel Course: Inserting Sparkline Graphs
A sparkline graph is a graph small enough to fil in a cell (sparkline graphs are not available for versions of Excel lower than 2010).
To insert a graph, select the cell in which you would like it to appear and choose a graph style.
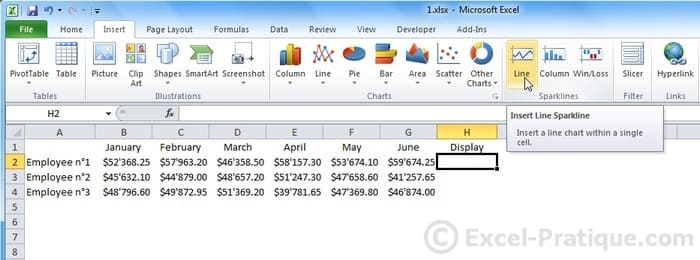
Select the range of source data and press OK.

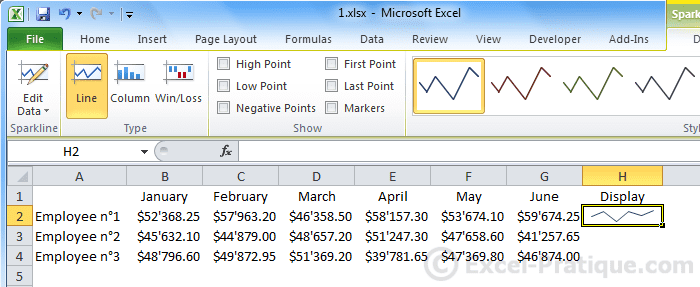
The graph has been inserted.
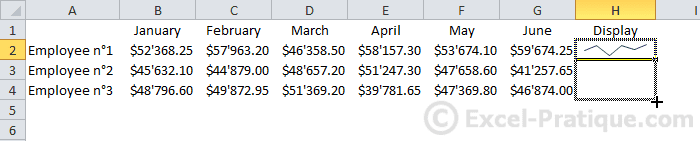
You can AutoFill the graph onto the following rows.
The "Design" tab allows you to edit the graph's formatting.
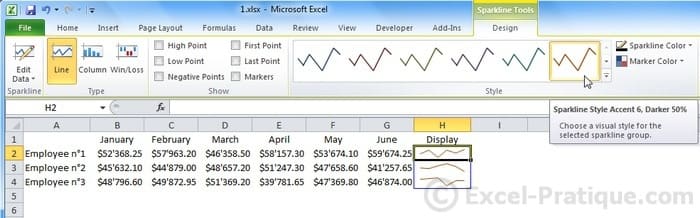
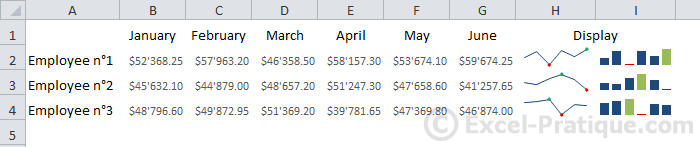
Sample formatting: